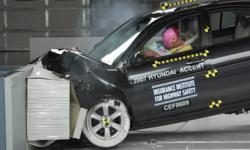
Real crash test dummies aren’t just props for Saturday Night Live skits or band names. They are the unsung heroes of automotive safety. Every year, fatality rates drop as cars improve. But crashes remain a leading cause of death and injury in the United States. The secret to safer roads isn’t magic. It’s a rigorous testing program.
These programs force manufacturers to design vehicles that protect occupants. You might not see the work, but you feel the results every time you merge onto the highway. Let’s look at how these programs work, the ratings they produce, and the technology inside the dummies themselves.
The Hybrid III Standard
When you see a frontal crash test in the US, one standard is used everywhere. The Hybrid III dummy. This consistency is non-negotiable. It guarantees that data from one lab matches data from another.
The dummy doesn’t just look human. It mimics human physiology. Take the spine. It isn’t a single rigid rod. It’s a series of alternating metal discs and rubber pads. This design absorbs impact in a way that mirrors a real human vertebral column.
Dummies are sized by percentile and gender. The most common is the 50th-percentile male. He represents the median male driver. He is bigger than half the population and smaller than the rest.
This specific dummy weighs 170 pounds. He stands 70 inches tall. That’s 5 feet 10 inches or roughly 1.78 meters. He is the baseline for safety ratings.
Inside the Instrumentation
A dummy is a robot of sensors. It collects data that no human could survive gathering. Three types of instruments are embedded deep within the synthetic body.
Accelerometers
These devices track acceleration in specific directions. They measure the rate at which speed changes. Think about hitting a brick wall. Your head stops instantly. The change in speed is violent. Now imagine hitting a pillow. The pillow crushes. The stop is gradual. The pillow saves your neck.
Accelerometers quantify this difference. They are placed in the dummy’s head, chest, pelvis, legs, and feet.
The head sensor measures acceleration in all three dimensions. Fore-aft. Up-down. Left-right. This data predicts the probability of injury. High acceleration? High risk of traumatic brain injury. Low acceleration? Better survival odds.
Load sensors
These measure the force applied to specific body parts. When a seatbelt locks, it exerts force on the ribs. The load sensor records that pressure. If the force exceeds a threshold, the ribcage might fracture. The sensor flags this failure.
Motion sensors
These track joint angles and displacement. Did the knee hit the dashboard? Did the femur bend too far? Motion sensors map the kinematics of the crash. They show how the body moves through the airbag deployment window.
“Acceleration is the rate at which speed changes… if you bang your head into a pillow, the speed of your head changes more slowly as the pillow crushes.”
This is the core physics of survival. It’s not just about stopping. It’s about how you stop. The Hybrid III dummy translates that physics into hard data. Manufacturers use that data to reinforce door pillars. To tune airbag deployment timing. To redesign crumple zones.
The tech is old, but it’s evolving. Newer dummies add more sensors. They measure torsion. They measure shear forces. But the Hybrid III remains the backbone of US safety testing. Without it, we’d be guessing. With it, we’re engineering.
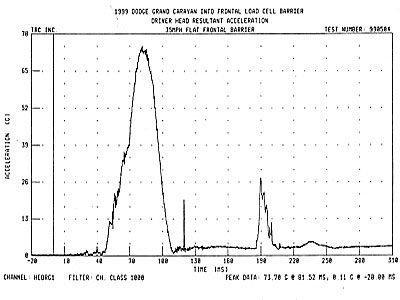
Head G-Force Dynamics
That graph isn’t showing a flat line. It’s jagged. Violent. It tracks the driver’s head during a 35 mph frontal impact—roughly 56.3 kph of pure kinetic energy dissolving in milliseconds. You see those spikes? Those aren’t glitches. They are the physical reality of deceleration. The head doesn’t just stop. It crashes. Every time it hits the steering wheel, the dash, or the deploying airbag, the acceleration sensor screams. The highest peaks correspond to the hardest impacts. It is a chaotic dance of inertia and restraint.
Internal Load Sensors
Outside the dummy is just plastic and paint. Inside, it is a network of sensors. These load cells are buried deep within the thorax, pelvis, and limbs. They measure the exact amount of force transmitted through the skeleton. No guesswork. Just raw data. When the body compresses, these sensors record the stress. We are looking for numbers that tell a story of survival or failure.
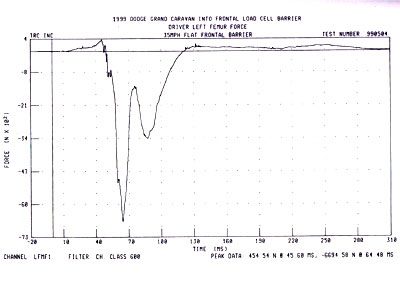
Crunching Numbers: Femur Force and Chest Deflection
Look at the graph. It plots force in Newtons against the driver’s femur during a 35-mph frontal impact. The peak value on that line isn’t just data. It tells you if the thigh bone snaps. Maximum load correlates directly with fracture probability. You see a spike? You see a break.
Below the chest sensors, things get mechanical. These movement sensors ride inside the dummy’s ribcage. They don’t just measure weight or speed. They track deflection. How far do the ribs collapse inward when the bumper hits? The sensors quantify that compression.
Why Chest Deflection Matters
A dummy is a proxy for human tissue. Bone is hard. Lungs are soft. The sensors capture the differential. When the chest deflects, internal organs suffer. The data from these sensors helps engineers predict thoracic injury. It’s not abstract. It’s the difference between a bruise and a punctured lung.
NHTSA uses this specific crash profile. 35 mph is the standard. It’s fast enough to cause serious damage but controlled enough to measure. The femur graph and the chest deflection data work together. One predicts bone failure. The other predicts internal trauma.
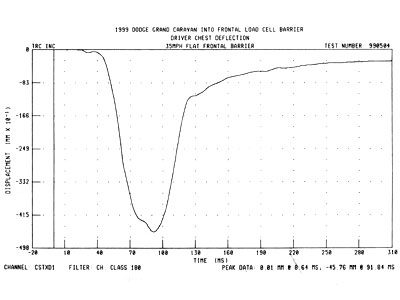
The scan reveals how much the driver’s chest compresses in a 35-mph frontal collision. In this specific scenario, the torso shrinks by about 2 inches (46 mm). It will hurt. It might leave a bruise. But it likely won’t kill you.
Let’s look at how the government actually tests this.
How NHTSA Tests Frontal and Side Impacts
The National Highway Traffic Safety Administration runs these numbers for the New Car Assessment Program. They don’t just guess. They measure.
The agency focuses on two main impact types.
35-mph frontal impact
The car hits a solid concrete barrier head-on at 35 mph (56 kph). Think of it this way: it is the same energy as two cars of similar weight hitting each other head-on, both moving at 35 mph. The barrier does not move. The car crumples.
The chest deflection in this test shows compression, not catastrophic failure.
35-mph side impact
This one is trickier. A 3,015-pound (1,368-kg) sled smashes into the side of the test vehicle. The sled has a deformable bumper. Its tires are angled.
Why the angle? It simulates a car crossing an intersection. Another car runs the red light and sideswipes it. The sled moves at 38.5 mph. The math changes because of the wheel angle. The result is equivalent to a 35-mph side impact.
The physics get weird here. The angle distributes force differently than a straight hit. The deformable bumper absorbs some shock. The car’s side structure takes the rest.
You don’t see the math in the crash. You see the damage. Or you don’t.
Decoding Dummy Paint Codes
The crash test dummies you see on screen aren’t just plastic mannequins. They are sophisticated measurement devices, and before they ever buckle up, researchers get creative with their appearance. Specifically, they apply distinct patches of paint to high-impact zones.
Why? To visually track where the force actually goes.
Each major joint and facial region gets its own color. The knees might be red. The face? Blue. The skull? Another shade entirely. It’s not for aesthetics. It’s forensic data disguised as a rainbow.
Watch the video linked in the original NHTSA release. The dummy goes through the motions, then stops. Look closely at the aftermath.
The blue paint from the dummy’s face is smeared on the airbag…
That smear isn’t dirt. It’s proof of contact. The airbag deployed, caught the face, and transferred the pigment. Meanwhile, the left knee—painted red—slammed into the steering column.
Why Paint Matters in Crash Safety
This isn’t just for show. Engineers need to know exactly what the body hits. Sensors tell you when and how hard, but paint tells you where.
If the blue face paint doesn’t show up on the airbag, the airbag failed to catch the occupant. If the red knee paint is missing from the dashboard, the knee might have slid under the belt or hit something unexpected.
It’s a simple, visual verification system.
- Face (Blue): Tracks airbag deployment success.
- Knees (Red): Checks for steering column or dash impact.
- Skull: Monitors head movement and secondary impacts.
In the video, you can see the red knee paint clearly transferred to the steering column. The blue face paint is smeared across the airbag. The physics played out exactly as the sensors predicted.
This method saves time. Engineers can review footage and instantly spot discrepancies without waiting for full sensor analysis. It’s a quick check. A visual sanity test for safety systems.
But here’s the thing. Paint only shows contact. It doesn’t show force. Or angle. Or duration.
So while the paint confirms what was hit, the data logs confirm how it was hit.
Next time you watch a crash test, don’t just look at the destruction. Look for the colors. They’re the first clue to how the car protected—or failed—the human inside.
The red paint on the column says one thing. The blue smear on the bag says another. Put them together, and you start to understand the story of the crash.
It’s not always clean. Sometimes the paint smears wrong. Sometimes the knee hits something it shouldn’t. And that’s when the real engineering begins.
Reading the Crash Marks
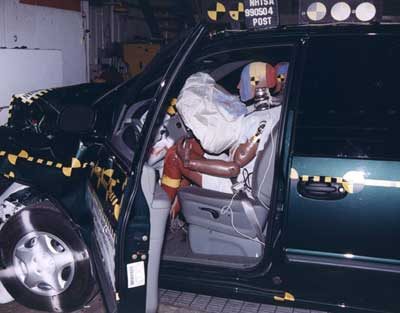
Look at the dummy. It’s covered in a chaotic mix of colors. Those aren’t just aesthetic choices. They are data points.
When a crash test happens, the dummies inside are rigged with accelerometers. These sensors measure g-force, tracking exactly how hard the head moves. But sensors only tell you so much. They tell you the head snapped back. They don’t tell you what it hit.
That’s where the paint comes in.
The multicolored coating on the dummy acts like a forensic map. If the accelerometer spikes, researchers know something went wrong. Then they look at the interior of the vehicle. A smudge of blue on the dashboard means the forehead took the brunt. A streak of red on the A-pillar suggests the temple connected with the metal frame.
The paint marks indicate what part of the body hit what part of the vehicle inside the cabin.
This correlation is the key to safety engineering. You can’t fix a problem if you don’t know the mechanics of the failure. Knowing that a specific impact pattern leads to a skull fracture allows engineers to tweak the cabin geometry. Maybe they soften the dash. Maybe they change the angle of the windshield. Maybe they add padding where the paint says it’s missing.
It’s not about guessing. It’s about mapping the violence. The dummy doesn’t lie. It just shows you where the pain was.
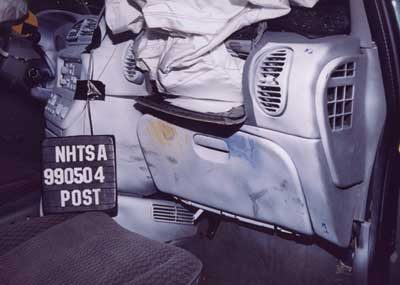
The Frontal Impact Setup
Watch the dummy’s knees slam into the dash. It’s a brutal sight. But look closer at the engine bay. Nothing made it into the cabin. That’s no accident. Most manufacturers mount engines so they slide backward and downward on impact. A clever trick to keep metal away from your legs.
Now we shift gears. A 35-mph frontal test is next.
Preparing the Van
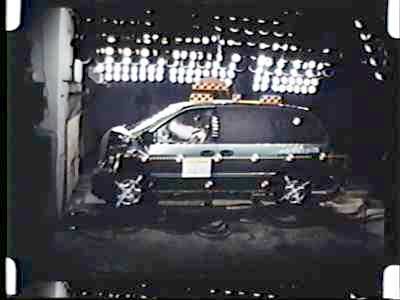
The van in the photo isn’t just parked there. It’s primed for violence. Dummies are strapped in. Instrumentation is hooked up and double-checked. Every sensor matters when data is on the line.
Ballast fills the interior. Why? Weight distribution. The crash-test vehicle must mimic a fully loaded road car. Mass changes physics. If the weight is wrong, the crash dynamics are wrong.
A speed sensor mounts to the chassis. It sits low. Positioned to trigger a pickup just before impact. Precision timing. One millisecond off, and the whole test is garbage.
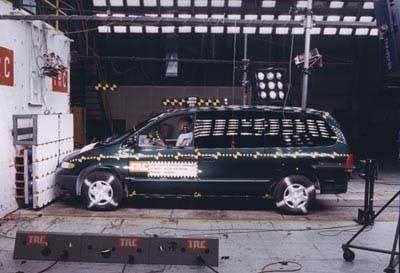
The Mechanics of Impact
The setup is almost cinematic in its precision. Fifteen high-speed cameras capture the chaos, including several positioned beneath the chassis to look up, tracking deformation from below. These lenses shoot at roughly 1,000 frames per second. They don’t miss a thing.
The vehicle is positioned in front of a rigid barrier. Notice the camera’s speed sensor mounted nearby, there to confirm velocity. Once aligned, the minivan is backed away from the wall. The air is cleared. A pulley system, running along a dedicated track, grabs the front end and yanks the car down the runway.
Acceleration is brutal. But it’s brief.
The impact happens fast. The vehicle smashes into the barrier at exactly 35 mph. That’s the standard for these frontal crash tests. Physics takes over immediately. From the moment of contact to a complete stop, only about 0.1 seconds elapse. Time dissolves.
Decoding the Stars
The dust settles. The car is dead. Now we look at the damage to understand the safety rating.
“This car got four stars for both occupants in this frontal-crash test.”
Those four stars aren’t just a grade. They’re the result of complex biofidelity metrics measured by the sensors inside the crash test dummies. It means the structure held up reasonably well. It means the risk of serious injury was reduced compared to a three-star vehicle. But it’s not a perfect score.
A five-star rating requires lower g-force readings across the board. Less intrusion into the survival space. Better head protection. The four-star minivan performed adequately. It protected the driver and front passenger from fatal trauma in this specific 35 mph scenario. But there’s room for improvement. The bodywork is crushed. The engine bay is folded. The airbags deployed. It worked. But barely.
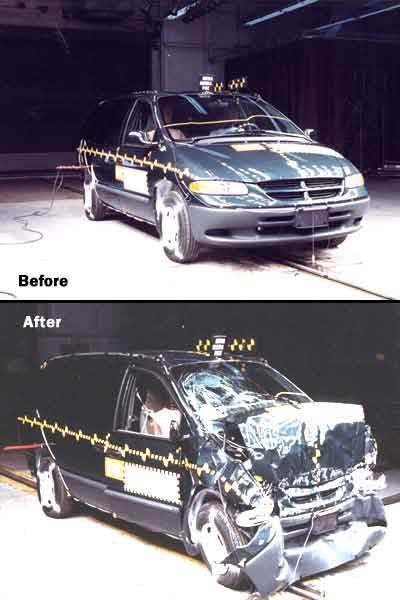
Why Crush Zones Matter
Look at that damage. The front end is gone. Total loss. Or so it seems to the untrained eye.
But here is the thing about front-end crumpling. It isn’t a failure. It’s a feature.
When you hit a barrier at speed, you are dealing with massive amounts of kinetic energy. That energy has to go somewhere. If the car doesn’t fold, that energy stays in the cabin. In your ribcage. Your skull.
NHTSA crash tests aren’t about preserving paint. They are about preserving life. The front structure is designed to collapse in a controlled manner. Think of it like a paper towel tube. Crush it, and it absorbs the blow. Keep it rigid, and the force transfers straight to whatever is inside.
“The car has to get crushed and collapse in order to absorb the kinetic energy and stop the car.”
This is the physics of survival. The bumper, the radiator support, the frame rails—all engineered to deform. They sacrifice themselves. The cabin, the safety cage, stays intact. That’s the trade-off. You lose the car. You keep the driver.
Modern materials help. High-strength steel in the A-pillars. Aluminum in the front ends. It’s a delicate dance between strength and flexibility. Get it wrong, and the car bounces back too hard. Or it doesn’t crumple at all. Both are bad.
So when you see a wrecked front end in a test video, don’t flinch. Nod. Because that crush zone did its job. It took the hit. It absorbed the chaos. And it gave you a fighting chance.
The rear looks fine. The side doors are fine. The airbags deployed exactly as intended. This is a good crash. A brutal one. But a good one.
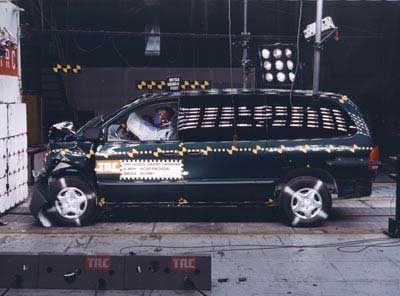
Kinetic Energy and the Physics of Survival
The van didn’t just dent. It lost 23 inches of length. The front end was crushed all the way back to the wheels, pushing them inward. That’s a lot of metal giving way.
Ideally, you don’t crash at all. But if you’re going to hit a barrier, the goal is survival. It comes down to kinetic energy. You’re moving at 35 mph. You have energy. You hit something. You stop. Zero energy left.
The trick isn’t stopping instantly. That kills you. You want to remove that energy as slowly and evenly as possible. Car safety systems are designed to manage that deceleration.
How Seatbelts and Airbags Work Together
It starts before the airbag even touches your face.
Seatbelt pretensioners and force limiters activate almost instantly after impact. The pretensioners pull the belt tight. This happens before the airbag deploys. The belt catches your forward motion first. It absorbs some of that initial kinetic energy.
Then, milliseconds later, the pressure in the belt would start to damage your ribs or internal organs. That’s when the force limiters kick in. They allow a controlled amount of give. They prevent the force from getting too high.
Next, the airbag deploys. It catches you. It protects you from the hard dashboard or steering column. It absorbs more forward motion.
If you’re not wearing a seatbelt, the pretensioner does nothing for you. You fly forward. You hit the airbag much harder. The energy transfer is brutal. Most cars now have these pretensioners and limiters. It’s standard. But the systems are getting smarter.
Smart Airbags and Regulatory Shifts
Airbags are everywhere now. They are sprouting from dashboards and doors. They stop you from hitting hard objects. But engineers want them to be smarter.
Enter the smart air bag.
These aren’t just inflation sacks. They adjust deployment speed and pressure. They look at two variables:
1. The weight and seating position of the occupant.
2. The intensity of the crash.
A child in a car seat needs a different deployment profile than a 200-pound adult in the driver’s seat. A low-speed fender bender doesn’t need the same force as a high-speed T-bone.
Traditional airbags can cause serious injury or death. The deployment force itself is violent. Advanced frontal air bag systems aim to reduce that risk. They enhance performance by tailoring the inflation.
The government is watching. The Federal Motor Vehicle Safety Standard No. 208 was amended. The rule is clear. Manufacturers must install these advanced systems. The timeline was strict. By September 1, 2005, all 2006 model year vehicles had to be equipped with the technology.
The Future of Restraint Systems
The next step goes beyond airbags.
Seatbelts are getting intelligence. They will sense weight and position. They will adjust tension and maximum force in real-time. It’s a continuous loop of monitoring and adjusting.
Carmakers are building safer vehicles. Technology enables this. Consumers are buying into it. Buying patterns reflect a demand for smarter protection.
It takes wrecking cars. It takes destroying test dummies. The data from those crashes is the only thing that matters. The information gained means you might survive. It might mean you walk away with little or no injury.
The van is shorter by 23 inches. You are still here. That’s the win.
Frontal Airbag Compliance List
The National Highway Traffic Safety Administration (NHTSA) has a specific list of vehicles that either already meet or were scheduled to meet advanced frontal airbag requirements by September 1, 2004. This isn’t just a random scatter. It covers a wide swath of the market, from luxury sedans to heavy-duty pickups.
If you are looking at used models from that era, these are the ones certified to handle the advanced frontal airbag mandates:
- BMW 525i, 530i, 545i
- BMW 645Ci and 645Ci convertible
- BMW X3 (2.5i and 3.0i)
- BMW Z4 roadster (2.5i and 3.0i)
- Dodge Durango
- Jeep Liberty
- Ford Escape
- Ford F-150
- Ford Taurus/Sable
- Mazda 3
- Mazda Tribute
- Mazda MPV
- Jaguar S-TYPE
- Jaguar XJ
- Jaguar X-TYPE
- Cadillac Escalade, Escalade EXT, and Escalade ESV
- Chevrolet Avalanche
- Chevrolet Silverado
- Chevrolet Suburban
- Chevrolet Tahoe
- GMC Yukon, Yukon XL, Yukon Denali, and Yukon XL Denali
- GMC Sierra
- Honda Accord
- Honda Odyssey
- Acura MDX
- Hyundai Elantra
- Kia LD
- Mitsubishi Galant
- Nissan Pathfinder Armada
- Nissan Quest
- Nissan Titan (King Cab and Crew Cab)
- Subaru Legacy
- Subaru Outback
- Suzuki Grand Vitara XL-7
- Lexus RX330
- Lexus ES330
- Toyota Camry
- Toyota Highlander
- Volkswagen New Beetle and New Beetle Convertible
Source: National Highway Traffic Safety Administration
Why Safety Is a Selling Point
Cars are safer now. That’s a given. But it didn’t happen by accident. Safety has become a marketing hook. Buyers actively seek out vehicles that protect them. The NHTSA drives this by crashing cars and crunching the data. Their goal is straightforward: improve safety standards.
Manufacturers aren’t just waiting for government tests. They crash their own vehicles every year. Federal Motor Vehicle Safety Standards (FMVSS) require certification. These rules are granular. They cover everything from turn signal bulb brightness to crash-test protocols.
The standard test involves hitting a dealer-bought car at 30 mph. It has to pass all FMVSS requirements. Manufacturers test for different engine, transmission, and accessory combinations. They might crash 60 to 100 vehicles to be sure. Failure is rare. But the NHTSA wanted more data. They created the New Car Assessment Program (NCAP).
NCAP runs crashes at 35 mph (56 kph). They test frontal and side impacts. They rate cars based on occupant injury likelihood. You can find these ratings online. It’s the first stop for anyone buying a new car.
Defining Serious Injury
How likely is a serious injury in a crash? The question is tough. You have to define “serious.” Researchers developed the Abbreviated Injury Scale (AIS). It classifies injuries from crashes. A manual details every injury type. Each gets a rank.
- Rank 1: Minor cuts and bruises.
- Rank 3: Serious injury requiring immediate treatment. Potentially life-threatening.
- Rank 6: Fatal.
This scale underpins the star rating system. It makes it easier for consumers to understand safety when shopping.
Frontal-Impact Star Ratings
Frontal crash ratings depend on the worst score across three criteria. Head Injury Criteria (HIC). Chest deceleration. Femur load. A five-star rating requires all three to stay below the level indicating a 10-percent chance of severe injury.
There are separate ratings for front-seat passengers. They vary by test type.
- 5 stars: 10% or lower chance of serious injury.
- 4 stars: 11% to 20% chance.
- 3 stars: 21% to 35% chance.
- 2 stars: 36% to 45% chance.
- 1 star: 46% or greater chance.
Side-Impact Star Ratings
Side crashes use two criteria. Thoracic Trauma Index (TTI). Lateral Pelvic Acceleration (LPA). To get five stars here, both must show less than a 5-percent chance of serious injury.
- 5 stars: 5% or lower chance of serious injury.
- 4 stars: 6% to 10% chance.
- 3 stars: 11% to 20% chance.
- 2 stars: 21% to 25% chance.
- 1 star: 26% or greater chance.
Additional Resources
For deeper dives into the mechanics and safety behind these numbers, check out these related guides:
- How Force, Power, Torque and Energy Work
- How Car Engines Work
- How Champ Cars Work
- How Air Bags Work
- How NASCAR Race Cars Work
- How NASCAR Safety Works
- How Emergency Rooms Work
Other useful links include:
- Buying A Safer Car
- Insurance Institute For Highway Safety: Vehicle Ratings
- Car hits a concrete wall at 200 miles per hour – No driver injury!
- IPSM Head Injuries
- GM Goodwrench Videos