


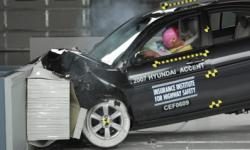
Crash test dummies have been mocked in cartoons, parodied in sketches, and even borrowed as a band name. But strip away the pop culture noise, and you find a very serious piece of technology. These aren’t props. They are the reason your car has five stars. They save lives.
Car crashes remain a leading cause of death and injury in the US. Fatality rates are dropping. Cars are getting safer. But the progress didn’t happen by accident. It happened because of rigorous, repeatable testing protocols. At the heart of this system is the Hybrid III crash test dummy.
The Science Behind the Dummy
Why not use humans? Because you can’t. You can’t strap a volunteer into a car and smash it into a barrier at 35 mph to see what happens to their spine. It’s unethical. It’s illegal. It’s impractical.
So engineers built a substitute. The Hybrid III dummy is designed to mimic human physiology with startling precision. It collects data that no living person could survive recording.
The spine, for instance, isn’t flesh and bone. It’s alternating layers of metal discs and rubber pads. This mimics the flexibility and stiffness of a human vertebral column. When the car stops, the dummy doesn’t just flop. It reacts. It absorbs. It records.
Sizing Up the Risk
Not all humans are the same. Crash testing accounts for this diversity. Dummies are categorized by percentile and gender.
The most common is the 50th-percentile male. This represents the median male driver. He’s taller than half the male population, shorter than the other half. He weighs 170 lbs (77 kg). He stands 5 ft 10 in (1.78 m).
Why this specific size? Because it covers the majority of the driving population. Smaller dummies represent females or children. Larger ones represent bigger adults. But the 50th-percentile male is the standard. Consistency matters. If every test used a different body type, you couldn’t compare results. You couldn’t say Car A is safer than Car B.
The Instruments Inside
The dummy is essentially a robot packed with sensors. Three types of instrumentation do the heavy lifting:
- Accelerometers
- Load sensors
- Motion sensors
These devices measure the forces acting on the dummy during a collision. They tell engineers exactly where the pain will be. And how severe it will be.
Accelerometers: Measuring the Impact
Accelerometers are everywhere. In the head. In the chest. In the pelvis. In the legs. In the feet.
Their job is simple: measure acceleration in a particular direction.
Acceleration is the rate of speed change. Think of it this way. If you hit a brick wall, your head stops instantly. High deceleration. Injury. If you hit a pillow, your head slows down gradually. Low deceleration. No injury.
The dummy’s head contains an accelerometer that tracks movement in all three axes: fore-aft, up-down, left-right. This data determines the probability of injury. A high spike in acceleration in the neck region might indicate whiplash. A sharp spike in the chest could mean rib fractures.
The data is raw. Unfiltered. Real.
And it’s this data that drives the next generation of safer cars. Every crash test informs the design of the next model. The dummy takes the hit so you don’t have to.
But the dummy is just the beginning. The real story is what happens to the car. How the structure deforms. How the seatbelt holds. How the airbag deploys. We’ll get to that. But first, we need to understand the forces at play.
Because in a crash, time is measured in milliseconds. And the difference between life and death is often less than a second.
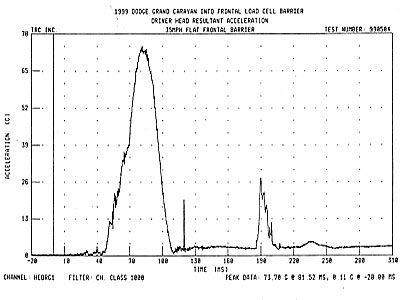

Head impact physics
Head acceleration is not a straight line. It rocks and tumbles, reflecting the chaotic physics of a 35 mph (56.3 km/h) frontal collision. The jagged graph you see is not noise. It is a mechanical record for head deceleration.
Peaks? This happens when your head hits something hard. The airbag deploys. Steering column buckle. The skull takes a hit. The graphic visualizes this violence in real time.
Inside the Dummy
A crash test dummy is not just a dummy with a plastic shell. It is full of sensors.
Load sensors are buried deep in the body, limbs and neck. They measure the exact force applied to each part of the body in a crash.
Accidents in the real world are chaotic. Data from these sensors is the only way to measure this chaos.
These sensors don’t just tell if someone survived. They will tell you how they survived. Where was the power concentrated? Did the chest compress too much? Is the neck bent back?
Engineers use data from these load cells to redesign seat belts, strengthen door frames, and fine-tune the timing of airbag deployment. Without them, security features are just guesswork. With them you have physics.
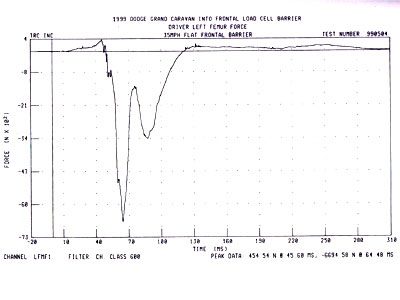
Femur Load Chart
This graph is not just abstract data. It shows the Newtonian force hitting the driver’s femur in a frontal collision at 35 miles per hour. Why is this important? This is because the peak load provides information on the probability of femur fracture. Higher numbers mean a higher risk of a serious fracture.
Chest Deflection Sensors
Look at the dummy’s chest. There are motion detectors inside. They measure chest deflection. During the impact, the chest is compressed. These sensors monitor exactly how much it gives.
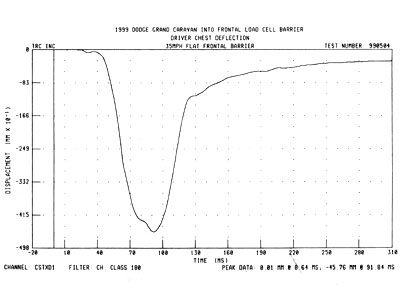
The image above follows the chest deflection during a 35-mph frontal collision. In this particular case, the driver’s body is compressed about 2 inches (46 mm). This level of deformation is painful. You may also need to see a doctor. However, it is not necessarily fatal.
Now let’s stop the simulation and look at the actual protocol.
How NHTSA tests vehicle safety
The National Highway Traffic Safety Administration is conducting two major tests as part of its new vehicle evaluation program. These are not just theoretical exercises. These are brutal physical realities designed to mimic ordinary accidents.
Frontal collision at 35 mph
The car crashed head-on into a solid concrete fence at 35 mph (56 km/h). There will be no bouncing. It stopped. difficult.
This setup simulates a collision between two vehicles of the same weight. If both cars are going 35 miles per hour, the force of the impact on either driver is about the same as hitting a stationary object at that speed. The most important thing here is energy dissipation.
Side Impact at 35 mph
Side impacts tell a different story. NHTSA uses sleds that weigh 3,015 pounds (1,368 kilograms). It features a deformable “bumper” designed to crush impact and absorb energy, just like the structure of a real car.
The sled’s tires are angled. This is not an error. This changes the way the sled interacts with the test vehicle. The sled is moving at 38.5 miles per hour, but the angle reduces the effective impact speed. If you do the math, that equates to a sideswipe at 35 mph.
The angled wheels of the sled is very important. They ensure that the test simulated a sideswipe with a vehicle running a red light, not a perpendicular T-bone crash.
This setting simulates a car crossing an intersection. Another car ran a red light and sideswipes it. The sled’s deformable bumper mimics the front end of the offending vehicle. The result? Realistic data about how the side structures hold up and how much force is transferred to the passengers.
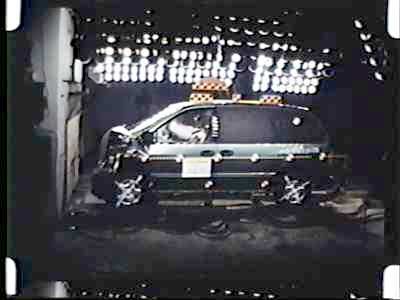
Decoding the paint code of the crash test
The drama begins before the impact. Before researchers strap the crash test dummies into the driver’s seat, they paint them. It’s not for aesthetics. The different colors highlight certain parts of the body that are most likely to collide with the car’s interior during a sudden stop.
Knees get one color. The face gets a different one. Certain areas of the skull are covered in a different shade. These visual cues tell a story that accelerometers alone cannot tell.
The results are immediately visible in the footage of the National Highway Traffic Safety Administration. You can see the aftermath of the impact in high resolution. The blue paint of the dummy’s face spreads over the deployed airbag. It tells you exactly where the head went. At the same time, the left, red-painted knee has hit the steering column. Color doesn’t lie. It maps crash kinematics in real time and provides direct insight into how the human body interacts with safety systems under extreme force.
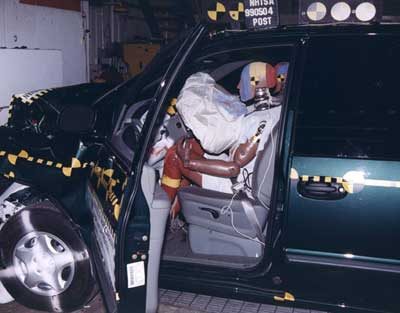

Crash test dummies are not just mannequins. They are complex repositories of information presented in a chaotic, multi-colored trauma map. If you look closely at the results, this bright color tells a story that sensors might miss.
As sensors embedded in the dummy’s skull register strong acceleration, the physical evidence in the cabin provides context. The special pattern of transferred color shows exactly which part of the body collided with which inner surface.
This visual correlation is key. It goes beyond just numbers to show causation. Researchers use these markings to find flaws in the vehicle’s design.
The paint doesn’t lie. It shows exactly where the human body did not survive the intended impact zone.
By combining high-acceleration data with specific impact points, engineers can make adjustments with greater precision. It’s not just about strengthening the frame. It’s about making sure that the interior doesn’t become a weapon against the passenger. This feedback loop drives next-generation safety features and transforms post-crash analysis into pre-crash prevention.
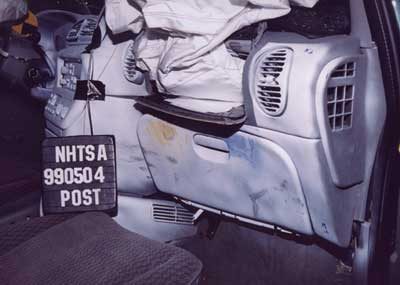

Crash test mechanics
Watch carefully how the dummy’s knees hits the dashboard. It’s a visceral detail, but it highlights how the cabin maintains its shape. More importantly, the engine compartment does not intrude at all. That isn’t luck. Car engineers mount the engines so that in a frontal collision, the powertrain is pushed back and down, away from the passengers. This is a safety feature disguised as a mechanical design.
Now we move on to the 35 mph front crash test.
Preparation before the crash
Before the barrier takes effect, the construction is careful. A van sits ready, dummies positioned inside, and every instrument part has been rechecked. Weight is just as important as speed. Ballast is added to the vehicle to match the mass and weight distribution of the fully loaded model.
A speed sensor is attached to the car, aligned to pass through the pick-up gate at the exact moment the vehicle hits the barrier. Precision is everything here.
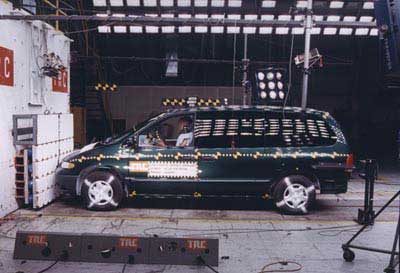

Fifteen high-speed cameras record the destruction. Some of them are placed under the vehicle and point towards the sky. They record approximately 1000 images per second. The setup is precise. Engineers back the minivan from the barrier. They check the sensors. A pulley system on the rail grabs the vehicle. It accelerates it on the runway.
The collision occurs at a speed of 35 miles per hour.
The car hits a rigid obstacle. The whole event takes about 0.1 seconds. This is how long it takes for the minivan to come to a complete stop. The physics are brutal. Data is captured in this fraction of a second.
What Happens After the Crash?
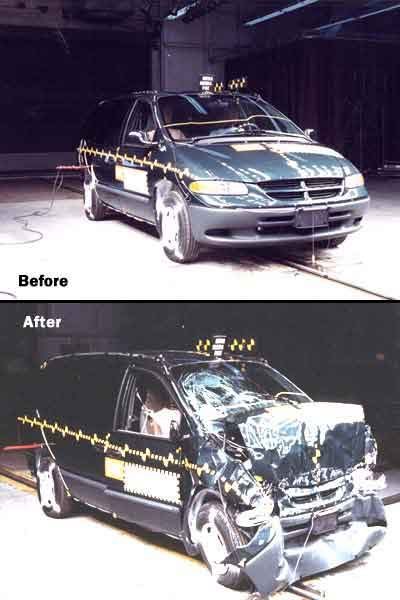
The wreckage tells a story. See the pictures. The front is crushed. The cabin remains intact. This minivan scored four stars for both occupants in this frontal crash test. Not five. But not low either. It survived. The structure held. The airbags deployed. The occupants would walk away. Probably bruises. But alive.
The cameras are constantly rolling. Even after the car stops. They collect the falling dust. Transformation. The final condition of the vehicle. It’s a controlled explosion. Designed to test safety limits. The results are clear. Four stars. A strong but not perfect result.

受控破坏的物理原理
See NHTSA image. The front of the sedan was destroyed. To the untrained eye, this may look like a complete failure. According to the engineers, the work was done correctly.
Metal just doesn’t bend. It’s collapsing.
这不是损坏。 This is the design.
When a vehicle hits an obstacle at high speed, the vehicle’s kinetic energy is not lost. It has to go somewhere. If the car is made of unbreakable steel and stops quickly, the energy is transferred directly to the passengers. 你的肋骨将成为溃缩区。
Instead, modern car safety relies on 溃缩区. These are special areas designed to shape in a predictable way. The front structure is designed to bend, fold and compress in a controlled manner. This process increases the time it takes for the car to stop.
The longer the stopping time, the lower the deceleration force.
Smaller deceleration forces reduce damage to the passenger compartment. The safety cage remains rigid. The front sacrifices itself so the people inside don’t have to.
“For the kinetic energy to be absorbed and the car to stop, it must be smashed by smashing.”
Sounds contradictory. We buy cars to avoid damages. However, in the event of an accident, structural damage in the right place is the only way to keep the 乘员舱 intact. 前部的残骸 is the price of survival behind.
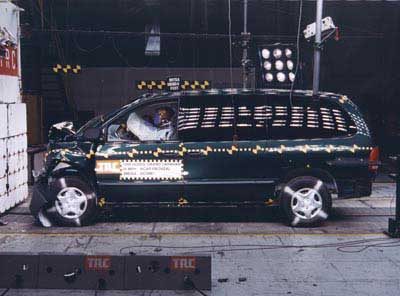

The front of the van is completely destroyed, right down to the front wheels, which have been pushed back into the cab. In this particular test, the vehicle shrank 23 inches (58 cm) in length. That’s a lot of metal to absorb shocks.
Coping mechanisms
Of course, the ideal crash is to not crash at all. But when you hit a wall, you want the best chance to get out. How are all security systems coordinated to make this possible?
Surviving a collision depends on kinetic energy. When your body is moving at 35 mph, it is carrying a certain amount of kinetic energy. When the collision ends and you come to a complete stop, that energy is zero. The goal is to dissipate this energy as slowly and evenly as possible to minimize injury. Your car’s safety architecture is designed exactly for this.
Ideally, your car is equipped with belt tensioners and belt force limiters. These systems activate immediately after a crash, but before the airbag deploys. Pre-tensioners tighten the belt and dampen part of your forward motion. If the restraining force becomes painful or dangerous milliseconds later, force limiters engage. They ensure that the tension of the belt does not exceed the safe limit.
Then the airbag deploys. It dampens your forward motion and cushions you against hard interior surfaces. In this hypothetical scenario, all systems work together to gradually slow you down. Without a seat belt, this first level of protection is no longer possible. You would slam into the airbag with much greater force and increase the risk of serious injuries. Most modern cars have seat belt pre-tensioners and limiters, but technology is evolving.
Smarter security systems and future technology
Airbags seem to appear in every conceivable corner of modern vehicles. They prevent your body from hitting hard objects, which is their main job. But engineers are always looking for ways to improve. Currently, the focus is on making security devices “smarter”.
The latest development is the smart airbag. These systems can adjust the deployment speed and pressure based on the occupant’s weight, seating position, and crash severity. It’s no longer a one-size-fits-all approach.
Unfortunately, airbag deployment can sometimes lead to serious injury or even death. Advanced frontal airbag systems are designed to reduce this risk and improve overall performance. The industry takes this so seriously that the Federal Motor Vehicle Safety Standard No. 208 has been amended. This rule requires manufacturers to install these new systems in all new vehicles. By September 1, 2005, all 2006 model year vehicles were required to be equipped with this technology.
In the future, we will see seat belts that also recognize the passenger’s weight and position and adjust the tension and maximum force in real time. The technology allows car manufacturers to build safer and smarter vehicles. Consumers voted with their wallets and supported this trend. It may require destroying countless cars and destroying crash test dummies, but the information gathered from these tests means you and your family have a much better chance of surviving a crash with minimal injuries. The question is not whether the technology will work, but rather how long it will take before next-generation safety systems become standard on every affordable road car.
Meets advanced airbag standards
The National Highway Traffic Safety Administration (NHTSA) has taken a strict stance on modern safety systems. If you look at these specific models, you will find that they are either already certified to meet advanced frontal air bag requirements or will meet the standards by September 1, 2004. This is the regulatory checkpoint that defines the generation of the vehicle.
This list included almost every major manufacturer in the US market at the time. BMW covers the 525i, 530i and 545i sedans. 645Ci coupe and convertible. X3 Utility Vehicle (2.5i and 3.0i models). And the Z4 Roadster. It also strongly reflects the strength and practicality typical of America. Dodge launched the Durango, Jeep Liberty and Ford Escape, F-150 and Taurus/Sable.
General Motors played an important role in these early safety directives. The Cadillac Escalade family (Standard, EXT, ESV) joins the Chevrolet Avalanche, Silverado, Suburban and Tahoe. GMC completes its Yukon lineup with the Denali trim. Japanese manufacturers are not far behind. Honda will launch the Accord and Odyssey along with the Acura MDX. Mazda released the “3”, “Tribute” and “MPV”. Nissan includes the Pathfinder Armada, Quest, King Cab and Crew Cab Titan. Examples are Toyota’s Camry and Highlander, Subaru’s Legacy and Outback, and Mitsubishi’s Galant.
Great and niche players fill the list. Includes Jaguar S-TYPE, XJ and X-TYPE. Lexus introduced the RX330 and ES330. Entries from Europe are small, but noteworthy. It is the Volkswagen New Beetle and its convertible version. Smaller companies such as Suzuki (Grand Vitara XL-7), Hyundai (Elantra) and Kia Motors (LD) also participate in this regulation.
The Economics of Safety
Security used to be an afterthought. Now that’s a big selling point. In fact, American consumers come to dealerships looking for higher crash ratings. This change has also forced a change in the way cars are manufactured. NHTSA just doesn’t look. it intervenes. They crash the vehicles and analyze the data to advance the viability of the industry.
Manufacturers are also in the crossfire. You must prove that your vehicle complies with the Federal Motor Vehicle Safety Standards (FMVSS). These rules are fine-grained. These determine everything from the turn signal lights to the structural integrity of the cab in the event of a crash. You can’t guess the manufacturer. If the NHTSA walks into a US dealership, buys a car and crashes it at 30 miles per hour, the car must meet all FMVSS requirements.
To ensure compliance with various engine blocks, transmissions and accessory packages, automakers often crash 60 to 100 vehicles themselves before the government intervenes. Although failure is rare, the threat of regulatory failure is costly. So NHTSA went a step further and created the New Car Assessment Program (NCAP). They collided at 35 mph (56 km/h) in both frontal and side impacts. The goal is simple. Its purpose is to assess the possibility of injury to passengers. These grades can be found online. It should be the first stop for anyone shopping for a new car.
Defining “Serious Injury”
How bad can it get? That’s the question. To answer this question, we need to define what “severe” actually means in a biomechanical sense. Researchers have developed the AIS (Abbreviated Injury Scale) scale to classify injuries. This is not just a fracture problem. It’s about physical trauma. Handbooks for these injuries are full of medical terminology.
Levels range from 1-6.
– 1: Minor cuts and bruises. You’ll need a bandage.
– 3: Serious injuries. Immediate medical attention is needed. It can be life-threatening.
– 6: Deadly.
AIS provides the basis for the star rating displayed on NHTSA’s website. Without a standardized definition of injury severity, estimates are just arbitrary numbers.
How the star rating works
The NHTSA STAR system transforms complex crash data into content that consumers can understand. This is not the slope of the curve. This is a probability threshold based on certain biomechanical criteria.
The classification of frontal collisions is determined based on the worst score of the three metrics:
1. Head Injury Criteria (HIC): Measures the likelihood of a skull fracture or brain injury.
2. Chest deceleration: Measures the force on the chest that can compress organs.
3. Femur load: Measures the force on the femur transmitted to the spine or pelvis.
To receive a 5-star rating in a frontal crash, all three values must be below the threshold indicating a 10% chance of serious injury. Ratings are applied separately for each front seat position and each test type.
Frontal-Impact Star Ratings:
– 5 stars: Chance of critical damage is less than 10%.
– 4 stars: 11-20% chance of serious injury.
– 3 stars: 21-35% chance of serious injury.
– 2 stars: 36-45% chance of serious injury.
– 1 Star: At least 46% chance of serious injury.
Side impact accidents are different. Since the attack is lateral, the dynamic changes. Here the standard changes to:
1. Thoracic Trauma Index (TTI): focuses on rib fractures and internal injuries.
2. Lateral Pelvic Acceleration (LPA): Measures forces on the pelvis that can cause spinal instability.
The likelihood of getting a 5-star rating for side effects is even more difficult. Both criteria must be in the range where the chance of serious damage is less than 5%.
** Side-Impact Star Ratings:
– 5 stars: Chance of critical damage is less than 5%.
– 4 stars: 6-10% chance of serious injury.
– 3 stars: 11-20% chance of serious injury.
– 2 stars: 21-25% chance of serious injury.
– 1 star:** 26% or more chance of serious injury.
Read more
If you want to dig deeper into why these grades are important, consider them from a few angles. Understanding the physics behind accidents is half the battle. Explore how forces, power, torque and energy interact during a collision. Or maybe you’re interested in how engines determine a vehicle’s mass and momentum.
The airbags themselves are complex systems. Understanding how airbags deploy and retract can add context to FMVSS certification. For those interested in high performance safety, the protocols used in Champ Car and NASCAR offer a different but extreme perspective on driver protection. Emergency room information also affects post-accident outcomes, linking pre-accident safety to post-accident survival.
For practical Buying Advice, the Insurance Institute for Highway Safety (IIHS) offers additional ratings. Their tests may differ in approach and provide a second opinion on the safety of your vehicle. There are also interesting cases that highlight the limitations of current safety technology, such as the case where a car crashed into a concrete wall at 200 mph, but the driver was uninjured. More technical information can be found in IPSM Head Injury Resources and videos from manufacturers such as GM Goodwrench on how to test and service these vehicles.


